
Usage analytics
Track your school's activity: publications, communication reach, active families, absences, and portal usage. Available from the Brot plan onwards.
2026-08-09
Before you start
- You need the Brot plan or higher. If your school is on the Llavor plan, the section displays an upgrade prompt.
- With the Brot plan you can view statistics for the last 7 days. The Arrel plan unlocks longer periods: Last month, Last 3 months, and School year.
- Access it from the sidebar menu → Analytics.
Step by step
Selecting a period
Open the Analytics section
In the sidebar, click Analytics. At the top of the page you will see the four area tabs and the period selector on the right.
Choose the date range
Click the period selector and choose your option: Last 7 days (available on all plans), or Last month, Last 3 months, or School year (Arrel plan and above).
All tab data updates automatically when you change the period.
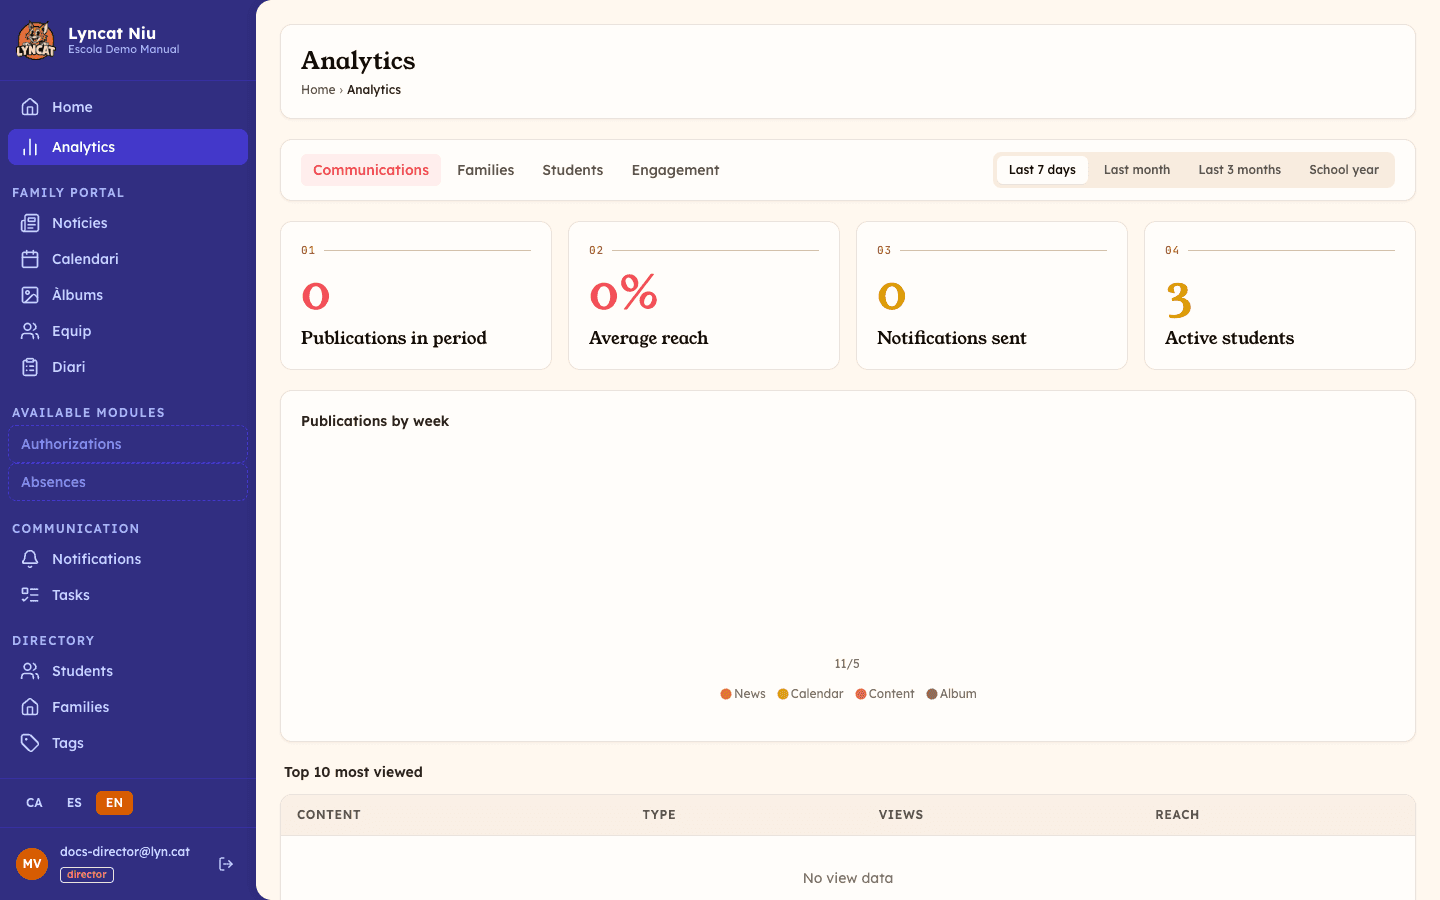
Communications tab
The Communications tab shows how families engage with the content you publish.
Key metrics:
- Publications in period — total content published in the portal (news, calendar, static content, and albums).
- Average reach — percentage of families that have viewed each publication on average.
- Notifications sent — number of push notifications sent to the family portal.
- Active students — number of students currently active at the school.
The weekly chart shows the distribution of publications by type. Below that, the Top 10 most viewed table lists the most-read content. If any publications have zero views, an Unread section appears with a button to send a push reminder.
Families tab
The Families tab shows the growth and activation of the family group.
Key metrics:
- Active families — families that have accepted the invitation and have portal access.
- Pending invitations — invitations sent but not yet accepted.
- New in period — families that activated within the selected date range.
- Activation rate — percentage of accepted invitations out of the total sent.
The monthly chart shows the growth of new families. Below, you can see the list of pending invitations with an option to Resend invitation, and the list of active families.
Students tab
The Students tab centralises the daily tracking indicators.
Key metrics:
- Completed reports — number of reports published in the period.
- Possible reports — maximum expected reports (active students × days in period).
- Active students — number of students currently active.
- Absences in period — total number of absences recorded.
The weekly chart shows the distribution of absences. The completion by educator table lets you see how many reports each team member has published relative to the expected total.
Engagement tab
The Engagement tab shows portal usage data from families and staff.
Key metrics:
- Total events — total number of recorded actions.
- Active users — peak unique users in a single day within the period.
- Sessions started — number of portal sessions opened.
- Content views — number of content items consulted.
The area chart shows the daily evolution of activity. The table below breaks down event types by platform.
What to do if…
I can't see the Analytics section in the menu
Check that your school is on the Brot plan or higher. You can see the active plan under My Account → Plan. If you need to upgrade, see the Change plan guide.
The data looks incomplete or very low
Statistics only reflect activity within the selected date range. Try extending the period. Keep in mind that a new school may have little accumulated activity.
I can't select longer periods (month, quarter, year)
This option requires the Arrel plan. On the Brot plan, the maximum time window is "Last 7 days".
Frequently asked questions
Which plan activates analytics? The Brot plan and above. The Llavor plan does not include access to the analytics section.
How often is the data updated? Data is recalculated when you open or switch tabs, with up to a minute of caching. The Engagement tab is based on a view that refreshes hourly, so it can take up to an hour to reflect the most recent activity.
Can I export the data to a file? The usage metrics in this section can't be exported from the panel; if you need them in an external format, contact support. You can, however, export the operational families and students data (contacts, health, class lists) to Excel using the Export button on the Families and Students lists.
Does average reach include all families at the school? Yes, the calculation is based on the total number of active families (who have accepted the invitation), not on those who received a specific notification.